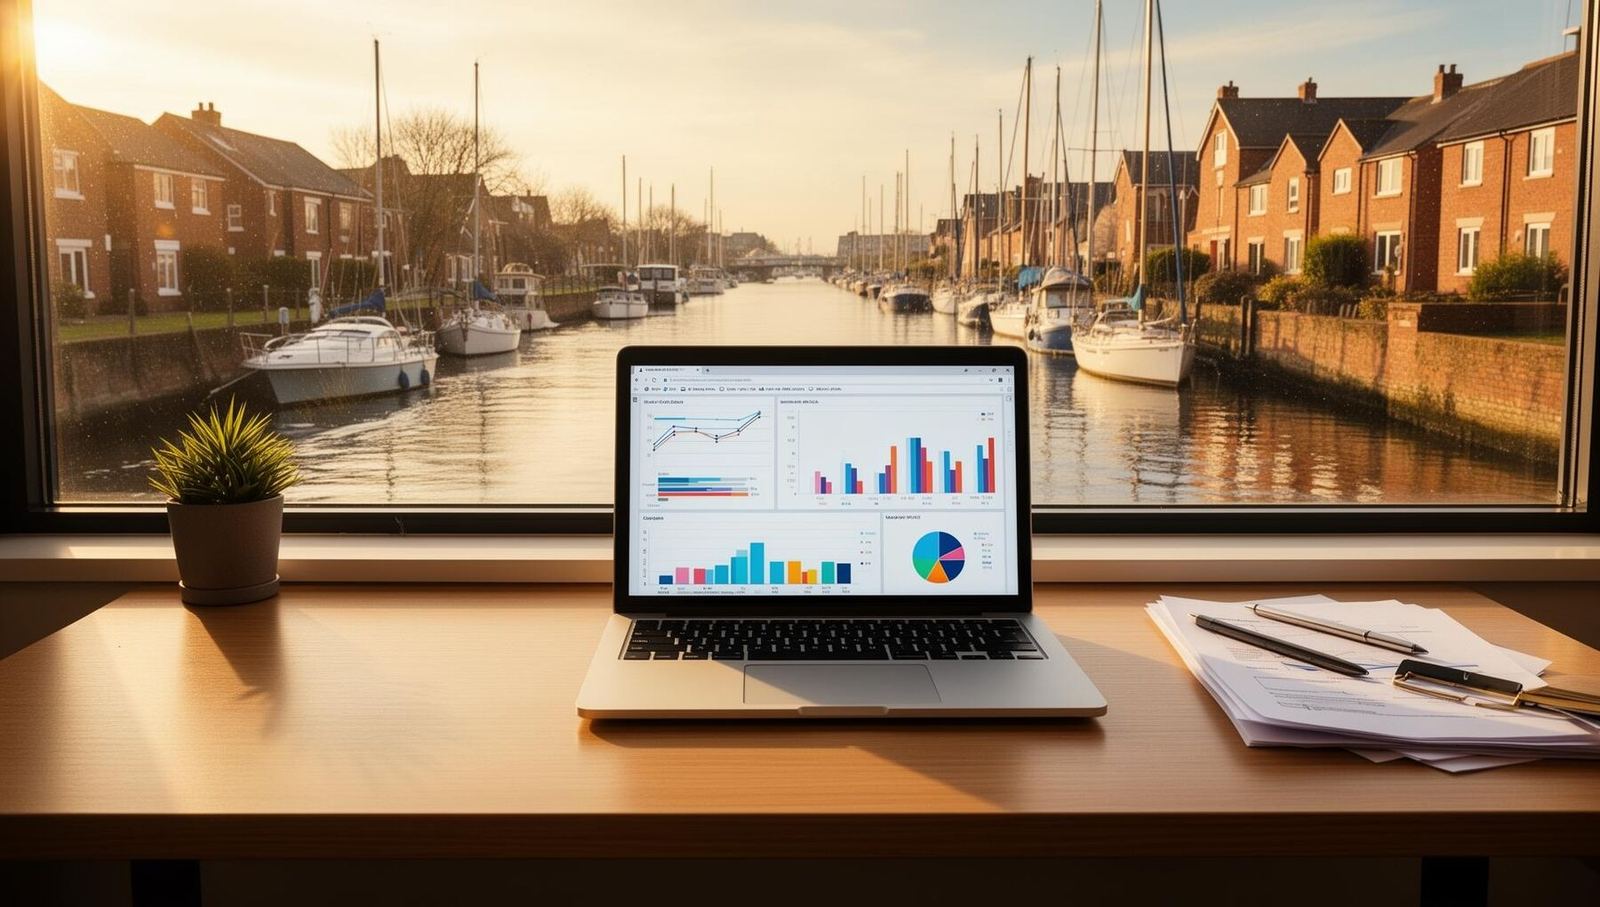
See the numbers. Make better decisions.
Dashboards and reports that show you occupancy rates, revenue trends, customer patterns, and seasonal performance. Export to spreadsheet any time.
14-day free trial · No credit card required
See It in Action
Here's what reporting & analytics looks like inside PayCamp.
Occupancy
78%
+4% vs last period
Revenue
£2,480
+12% vs last period
Outstanding
£340
-8% vs last period
Daily Occupancy
Switch time periods above — stats and chart animate instantly
Try it yourself — switch time periods and watch the stats and chart animate.
The Old Way vs The PayCamp Way
End-of-year accounting is a nightmare. No idea which months are your busiest. Can't tell if occupancy is up or down. Revenue figures come from adding up paper invoices. No data to make pricing decisions.
PayCamp tracks everything automatically and presents it in clear dashboards. See occupancy rates, revenue by period, customer trends, and outstanding payments at a glance. Export any report to CSV for your accountant.
What's Included
Everything you need for reporting & analytics, built into one platform.
Occupancy Dashboard
See current and historical occupancy rates by area, pitch type, or time period. Spot trends and plan capacity.
Revenue Tracking
Total revenue, revenue by source (bookings, electricity, yard), and comparisons to previous periods.
Outstanding Payments
See every unpaid invoice in one view. Filter by age, amount, or customer. Prioritise your chasing.
Seasonal Trends
Compare performance across seasons and years. Understand your peak periods and plan pricing accordingly.
Export to CSV
Export any dataset to CSV for your accountant, bank, or further analysis in a spreadsheet.
Who It's For
See Reporting & Analytics in Action
Explore a fully-loaded demo with real data. No signup required.
Takes 30 seconds • No credit card
Rather talk it through? Book a 20-minute call with Hamish →
Frequently Asked Questions
Ready to try Reporting & Analytics?
Start your free 14-day trial today, or talk it through with Hamish first.No credit card required.